Last month we received samples from a site off War Memorial Drive where the contractor hit a layer of fine sandy silt they didn't expect. The grain size curve flipped the foundation design from spread footings to a deeper system. That's Peoria for you. The Illinois River bluffs and the glacial outwash beneath the city create a patchwork of materials that demand precise classification. Our lab runs the full ASTM D422 procedure — sieve stack plus hydrometer — so you know exactly what you're building on. Whether your project is near the riverfront or up on the bluffs by Bradley University, the particle distribution dictates drainage, compaction, and bearing behavior. We've seen enough Peoria boreholes to know that skipping the hydrometer on fines can burn you later. If your test pits logged silty material, the full grain size analysis becomes non-negotiable.
A complete grain size curve isn't just classification — it's the first engineering parameter for drainage design, compaction control, and settlement prediction.
Our approach and scope
Peoria sits at roughly 660 feet above sea level, perched on the edge of the Illinois River valley. That elevation shift means the soil column can change completely within half a mile. Our analysis splits into two stages. First, the mechanical sieve stack covers coarse to medium particles — from gravel down to the No. 200 sieve. Then the hydrometer picks up everything finer, measuring particle diameter by sedimentation rate in a water column. We use ASTM D7928 for the hydrometer portion, applying Stokes' Law to calculate silt and clay fractions. The combined curve tells you the coefficient of uniformity, coefficient of curvature, and the exact percentages of gravel, sand, silt, and clay. For Peoria projects near the river, where alluvial deposits dominate, we often pair this with
Atterberg limits to define the plasticity characteristics of the fines. And when the grain size distribution suggests liquefaction-prone material, a
liquefaction assessment adds the seismic dimension required by the IBC.
Quick answers
How much does a grain size analysis cost in Peoria?
For a combined sieve and hydrometer test, you're looking at US$110 to US$170 per sample. The price depends on whether we're running just the sieve portion or the full curve with hydrometer. Bulk pricing applies for multiple samples from the same project.
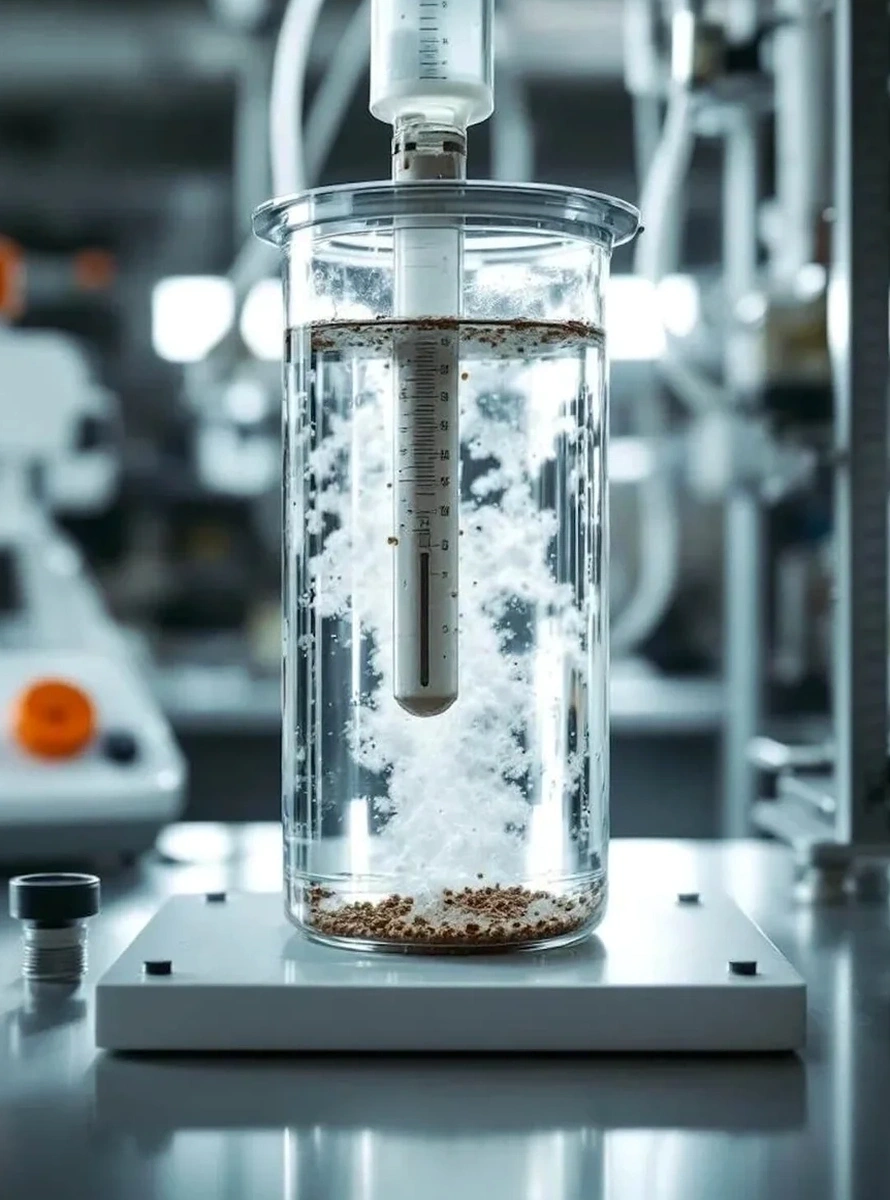
How long does the hydrometer portion take?
The hydrometer analysis runs a minimum of 24 hours because we take readings at specific intervals — 2, 5, 15, 30, 60, 250, and 1440 minutes. Full reporting usually takes 48 to 72 hours from sample receipt.
What sample size do you need for the test?
For the sieve analysis we need about 500 grams if the material is mostly sand and gravel. For the hydrometer, we need at least 200 grams passing the No. 200 sieve. We can extract that from a larger sample in our lab.
Do you classify the soil after the grain size test?
Yes. We classify every sample per ASTM D2487, which uses the grain size distribution and Atterberg limits to assign a Unified Soil Classification System (USCS) symbol. That gives you the engineering group name you need for your geotechnical report.
Can you test gravel larger than 3 inches?
We can, but the standard procedure changes. For material with cobbles or oversize particles, we separate the plus-3-inch fraction and run the sieve analysis on the minus-3-inch portion, then recombine mathematically. Let us know ahead of time so we can prep the right equipment.